|
|
This report will show you how well you are meeting the expected due dates for orders.
- From the Main Menu, select Reports -> Orders -> Performance Statistics.
- Your screen should look similar to this:
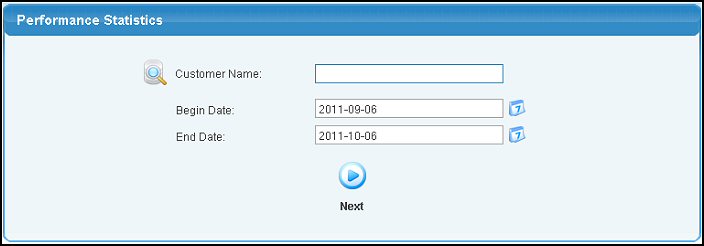
- Enter information into the following categories to narrow your report:
- Customer Name: Leave blank to include ALL Customers, or enter Customer Name (or any portion of the name) to bring up a drop-down of possible matches. If you want to search by phone, zip code, etc., use the
 Lookup button for detailed searches. Lookup button for detailed searches.
- Begin and End Dates: Manually enter a range of dates or use the
 Calendar button to select dates from a calendar. Calendar button to select dates from a calendar.
- To produce the report, click on the
 Next button. Your screen will appear similar to this: Next button. Your screen will appear similar to this:
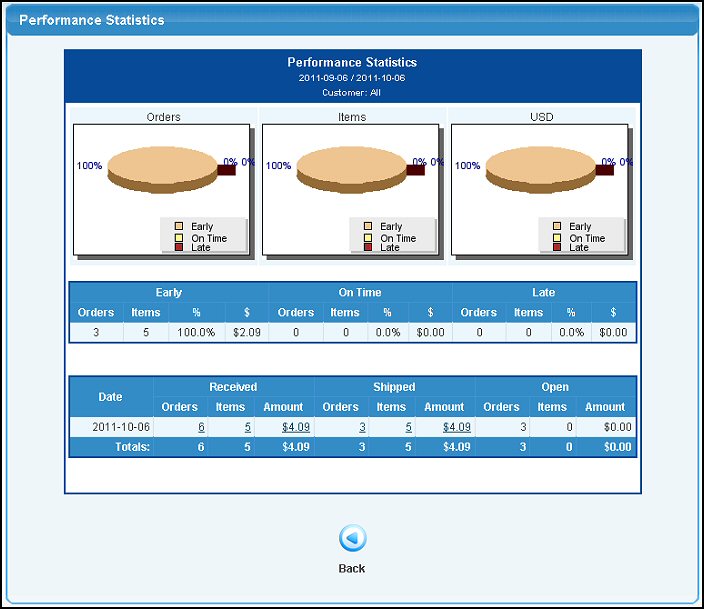
- The pie charts (and the data they are drawn from which is shown immediately under the charts) show performance based on the total number of orders that were on-time, late or early, the total number of items on orders which were shipped on-time, late or early, and the total dollar value of orders that were shipped on-time, late or early. By looking at performance from these three points of view, you get a much better idea as to real performance.
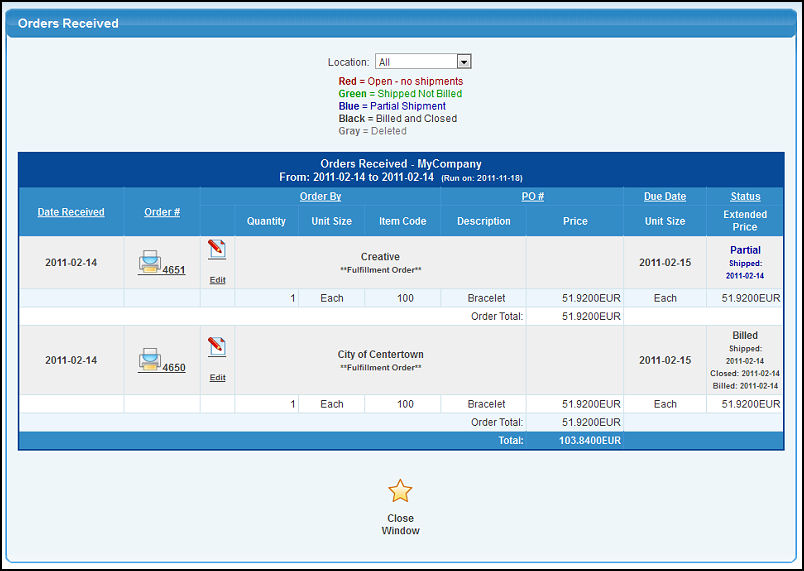
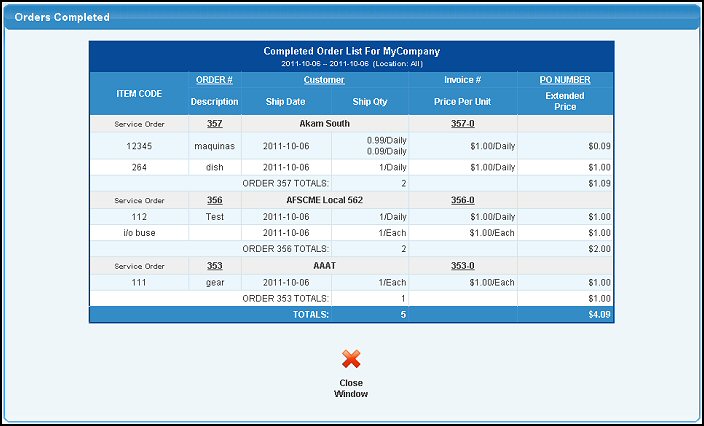
- Following this is a day-by-day breakdown of orders received, shipped and orders received on that day that are currently open. To see an actual listing of any of these, you can click on the various numbers shown in Blue to drill-down to the data underneath. The reports produced can be exported to a file in Microsoft Excel® format by clicking on the Export button in the Quick Links section of the footer at the bottom of the page.
- To return to the previous screen, click on the
 Back button. Back button.
| |
|